Wind and solar power produced more electricity than gas globally in April 2026, according to analysis from Ember cited by Electrek. The milestone is narrow, seasonal, and still useful: renewables generated 22% of the world’s electricity that month, compared with 20% from gas.
Table of Contents
The short version
- Wind and solar power generated 531 terawatt-hours of electricity in April 2026, while gas plants generated 477 TWh.
- The gap was 54 TWh, enough to make April the first month when wind and solar passed gas globally.
- Gas generation was almost flat over five years: 476 TWh in April 2021 and 477 TWh in April 2026.
- Wind and solar more than doubled over the same April-to-April comparison, rising from 245 TWh to 531 TWh.
- The record says as much about grid operations, storage, forecasting, and energy security as it does about generation capacity.
What happened
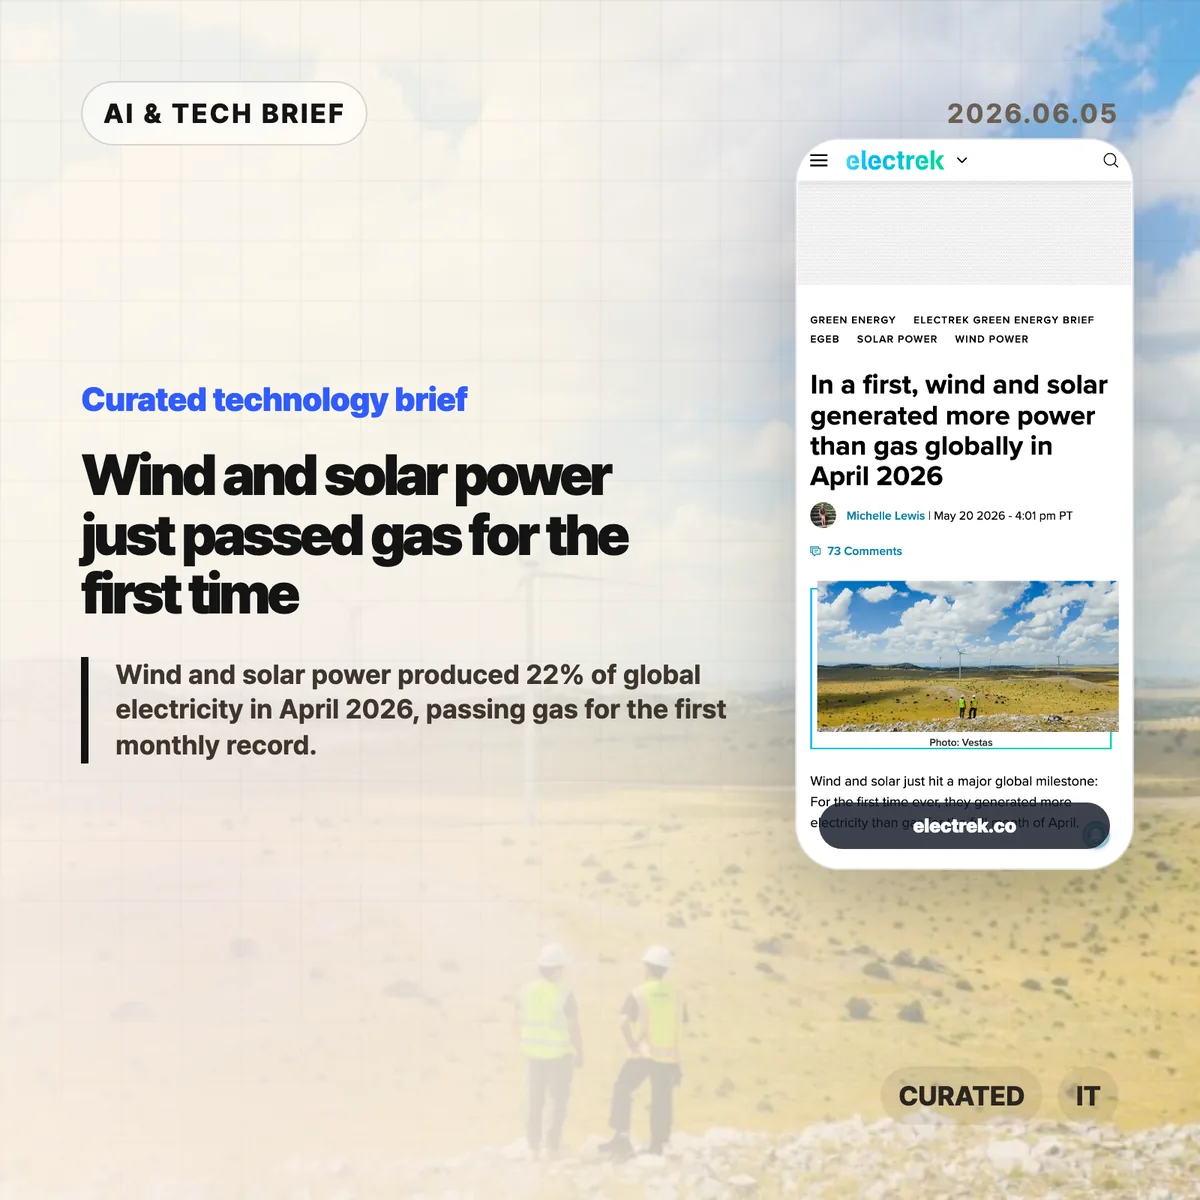
Wind and solar power crossed a monthly global electricity threshold in April 2026. Electrek reported that Ember’s analysis put wind and solar at 531 TWh for the month, or 22% of global electricity. Gas produced 477 TWh, or 20%. That made April 2026 the first full month in which wind and solar generated more electricity than gas worldwide.
The comparison is sharper when viewed over five years. In April 2021, gas generation was 476 TWh, almost the same as April 2026. Wind and solar, by contrast, rose from 245 TWh in April 2021 to 531 TWh in April 2026. One month does not settle the energy transition, but a five-year doubling against flat gas output is hard to dismiss as a weather blip.
Why wind and solar power is worth watching
Wind and solar power is worth watching because the record combines two stories that usually get separated: clean-energy buildout and power-system operations. Ember’s figures show a generation milestone, but the practical constraint is whether grids can absorb more variable supply without pushing reliability problems onto consumers and businesses.
April is a friendly month for this kind of record. In the Northern Hemisphere, heating demand has usually faded while cooling demand has not yet peaked. Wind conditions can be strong, and solar output is improving. That seasonal setup matters. Still, Electrek reported that wind and solar output rose about 13% year over year globally, with growth across major markets: China was up 14%, the EU 13%, the UK 35%, the US 8%, Australia 17%, Chile 24%, and Brazil 4%.
That spread matters more than the headline. A single market can have an odd month. Many markets moving in the same direction suggest that new capacity, grid integration, and energy policy are starting to show up in the global power mix.
What does wind and solar power change for builders?
Wind and solar power changes the planning problem for builders who depend on cheap and reliable electricity. Data centers, AI infrastructure teams, EV charging networks, industrial automation vendors, and climate-tech startups are no longer dealing with energy as a static utility bill. Electricity procurement is becoming part of product and infrastructure strategy.
For software and infrastructure teams, the interesting layer sits between generation and demand. Better solar and wind penetration creates more demand for forecasting tools, battery dispatch software, grid interconnection workflows, demand response systems, and power purchase agreement analytics. The companies that can match compute, storage, and flexible load to cleaner hours may get a real cost advantage.
This is also where the story touches app and marketplace discovery. Energy-management tools, battery platforms, charging apps, and industrial analytics products can increasingly position themselves around renewable availability, not only carbon accounting. For more technology briefs, see the IT & AI archive.
What the discussion is missing
There was no reliable Hacker News thread available for this brief, so the useful criticism has to come from the data itself. The first caveat is seasonality: April is structurally easier for wind and solar because demand is lower between heating and cooling peaks. A July or January record would say something stronger about stress-period reliability.
The second caveat is that passing gas for one month does not mean gas plants are obsolete. Gas still provides dispatchable capacity in many grids, especially when demand spikes or renewable output drops. Storage, transmission, and market design decide how fast that role shrinks.
The third missing argument is load growth. Electrek notes that wind and solar met most of the increase in global electricity demand in April, but demand itself is changing. AI data centers, electrified heating, EVs, and industrial loads could raise the bar. The next question is not whether wind and solar can win a low-demand month. It is whether new renewable output can keep outrunning demand growth during harder seasons.
The practical read
Treat the April 2026 record as a directional signal, not a victory lap. Wind and solar power has moved from a policy talking point into a measurable share of global electricity, but the bottleneck is shifting toward grid capacity, storage, permitting, and software that can coordinate supply and demand.
Energy buyers should ask where their loads can become flexible. Data-center operators should model power availability by region and hour, not only by headline electricity price. Climate-tech founders should look for the boring workflows around interconnection queues, battery dispatch, procurement, and forecasting. Those are the places where a generation milestone turns into operational work.
Gas is not gone. But it is no longer safe to assume that gas growth will automatically absorb every new watt of demand. If wind and solar can double over five years while gas stays flat, the next competitive edge may belong to teams that understand electricity timing as well as electricity volume.